
Help › Everyday use
Company overview
Every device the brain looks after on one page: what needs attention first, then every device, security, apps, the server, automations and recent activity.
Company in the menu is the page to start your day on. It answers "is everything all right?" in a few seconds, and when something isn't, every line takes you straight to where you fix it. It refreshes every 30 seconds.
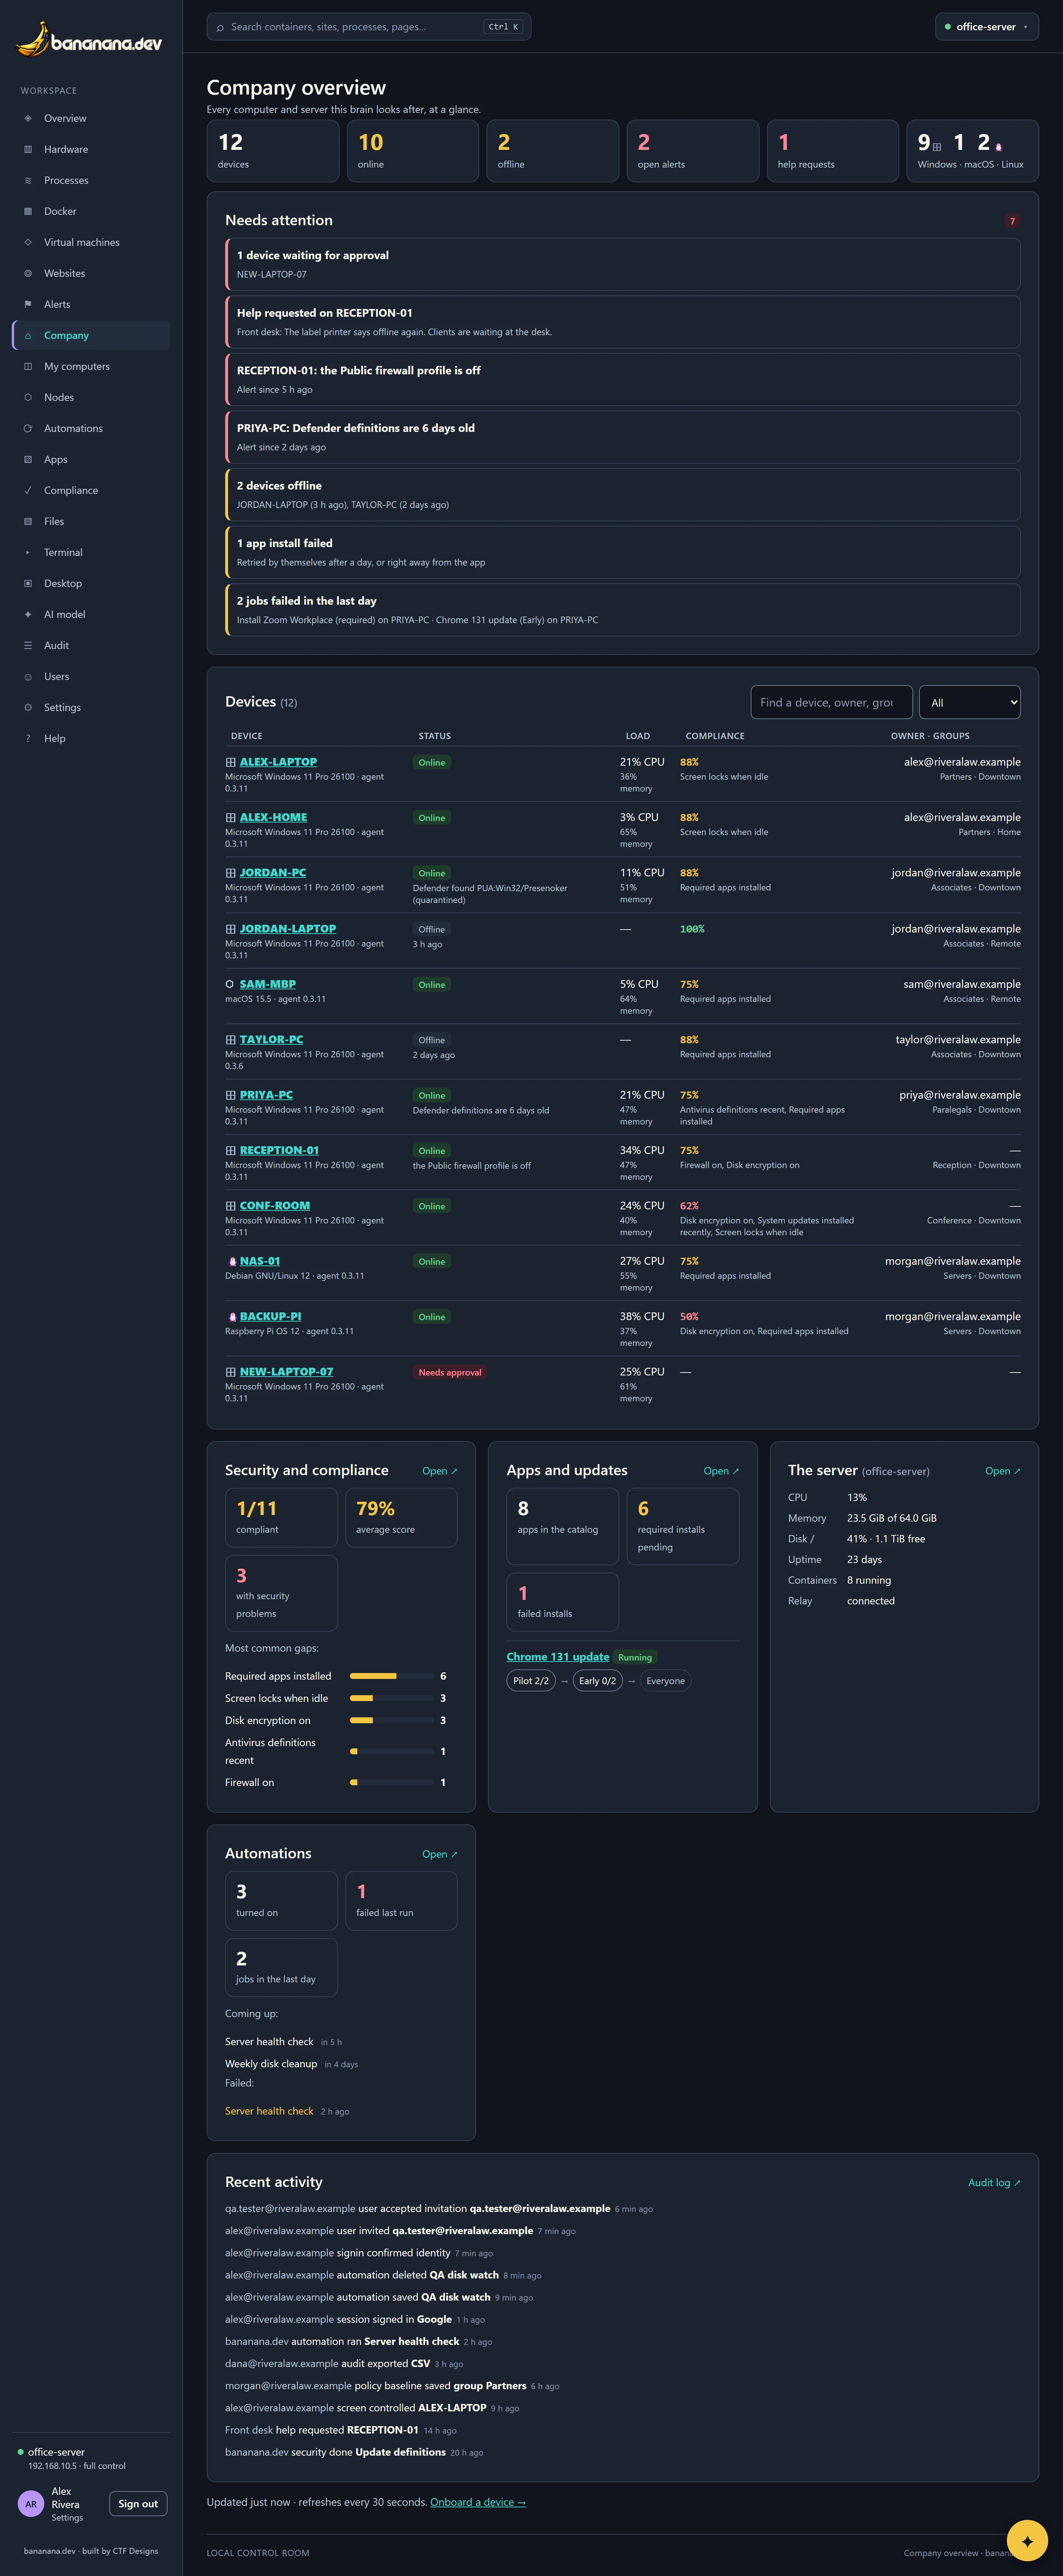
The tiles across the top
| Tile | Counts | Click to |
|---|---|---|
| Devices | Every device you may see, including ones waiting for approval. | Nodes |
| Online / Offline | Devices connected right now / not connected. Green when everything's online. | Nodes |
| Open alerts | Problems that are happening now: a disk filling up, protection off, a website down. | Alerts |
| Help requests | Requests people sent from the bananana.dev icon on their computer. | Nodes |
| Windows · macOS · Linux | How many of each. | Nodes |
Needs attention
A list of everything that wants a person, most urgent first, each with a coloured edge: red for "act now", yellow for "look soon". Click a line to go where it's handled. When there's nothing, it says so in green.
| Line | Means | What to do |
|---|---|---|
| Devices waiting for approval | A computer enrolled with an onboarding code or deployment key. Until approved it reports status only. | Check it's yours, then approve it: Approving devices. |
| Help requested on … | Someone pressed Request help on the bananana.dev icon by their clock. | Read the note, help them, then press Done on the Nodes page. |
| An alert (for example "the Public firewall profile is off") | Something crossed a threshold. | Click it: device alerts open that device's Security tab. What each alert means: Alerts and email. |
| Devices offline | Approved devices that aren't connected, with how long ago each was last seen. | Usually someone shut a laptop. If a desktop or server has been gone for hours, see Troubleshooting. |
| Agents behind the latest version | Devices running an older agent than the one published for their system. | Nothing, usually: they update by themselves while online. Or press Update all now on the Nodes page: The agent and the tray icon. |
| App installs failed | A required app didn't install. bananana.dev tries again after a day. | Open Apps and the app to read why: The app catalog. |
| Rollout paused | Too many devices in a ring failed an update, so the rollout stopped itself. | Read the failures, then resume or cancel: Rollouts and rings. |
| Jobs failed in the last day | Scripts or tasks that ended with an error. | The Audit log and each device's Device tab show which and why. |
| Not connected to the relay | The brain lost its connection to relay.bananana.dev; nodes can't reach it. | It reconnects by itself. If it lasts more than a few minutes, check the brain's internet connection. |
Devices
Every device in one table: name and system, online or offline (with "last seen" for offline ones), current load, compliance score with what's failing, and owner, groups and site. Click a name to open the device.
- Type in Find a device to filter by name, owner, group or site.
- The menu next to it shows only online, offline, devices with problems, or one system.
- "3 checks not reported" under a score means the device hasn't sent everything the compliance checks need. Often it's an older agent; updating it fixes that.
The panels underneath
Security and compliance
How many devices are fully compliant, the average score, how many have a security problem, and the most common gaps as bars ("Disk encryption on: 3"). Compliance
Apps and updates
Apps in the catalog, required installs still pending, failed installs, and each rollout in progress with how far it has got in every ring. The app catalog
The server
The brain itself: CPU, memory, free disk, uptime, running containers, healthy websites and the relay connection. The server's own pages
Automations
How many are on, which failed last time, how many jobs ran in the last day, and what's coming up next. Automations
Recent activity at the bottom shows the last dozen entries of the audit log: who did what, to what, and when.