
Help › Everyday use
The server's own pages
Overview, Hardware, Processes, Services, Docker, Virtual machines, Websites and Alerts: live readings and controls for the brain, or for whichever device you pick.
The first group in the menu shows one machine. Normally that's the brain, the server bananana.dev runs on. Pick another device in the switcher at the top right and the same pages show that device instead (with the brain-only ones hidden).
Overview
The machine at a glance: CPU, memory and disk use, running containers, a chart of CPU and memory, system health (uptime, hottest sensor, swap, virtual machines, website checks), and short lists of websites and containers. A yellow bar across the top lists any active alerts. The badge at the top right says how fresh the numbers are ("Live · 13s ago").
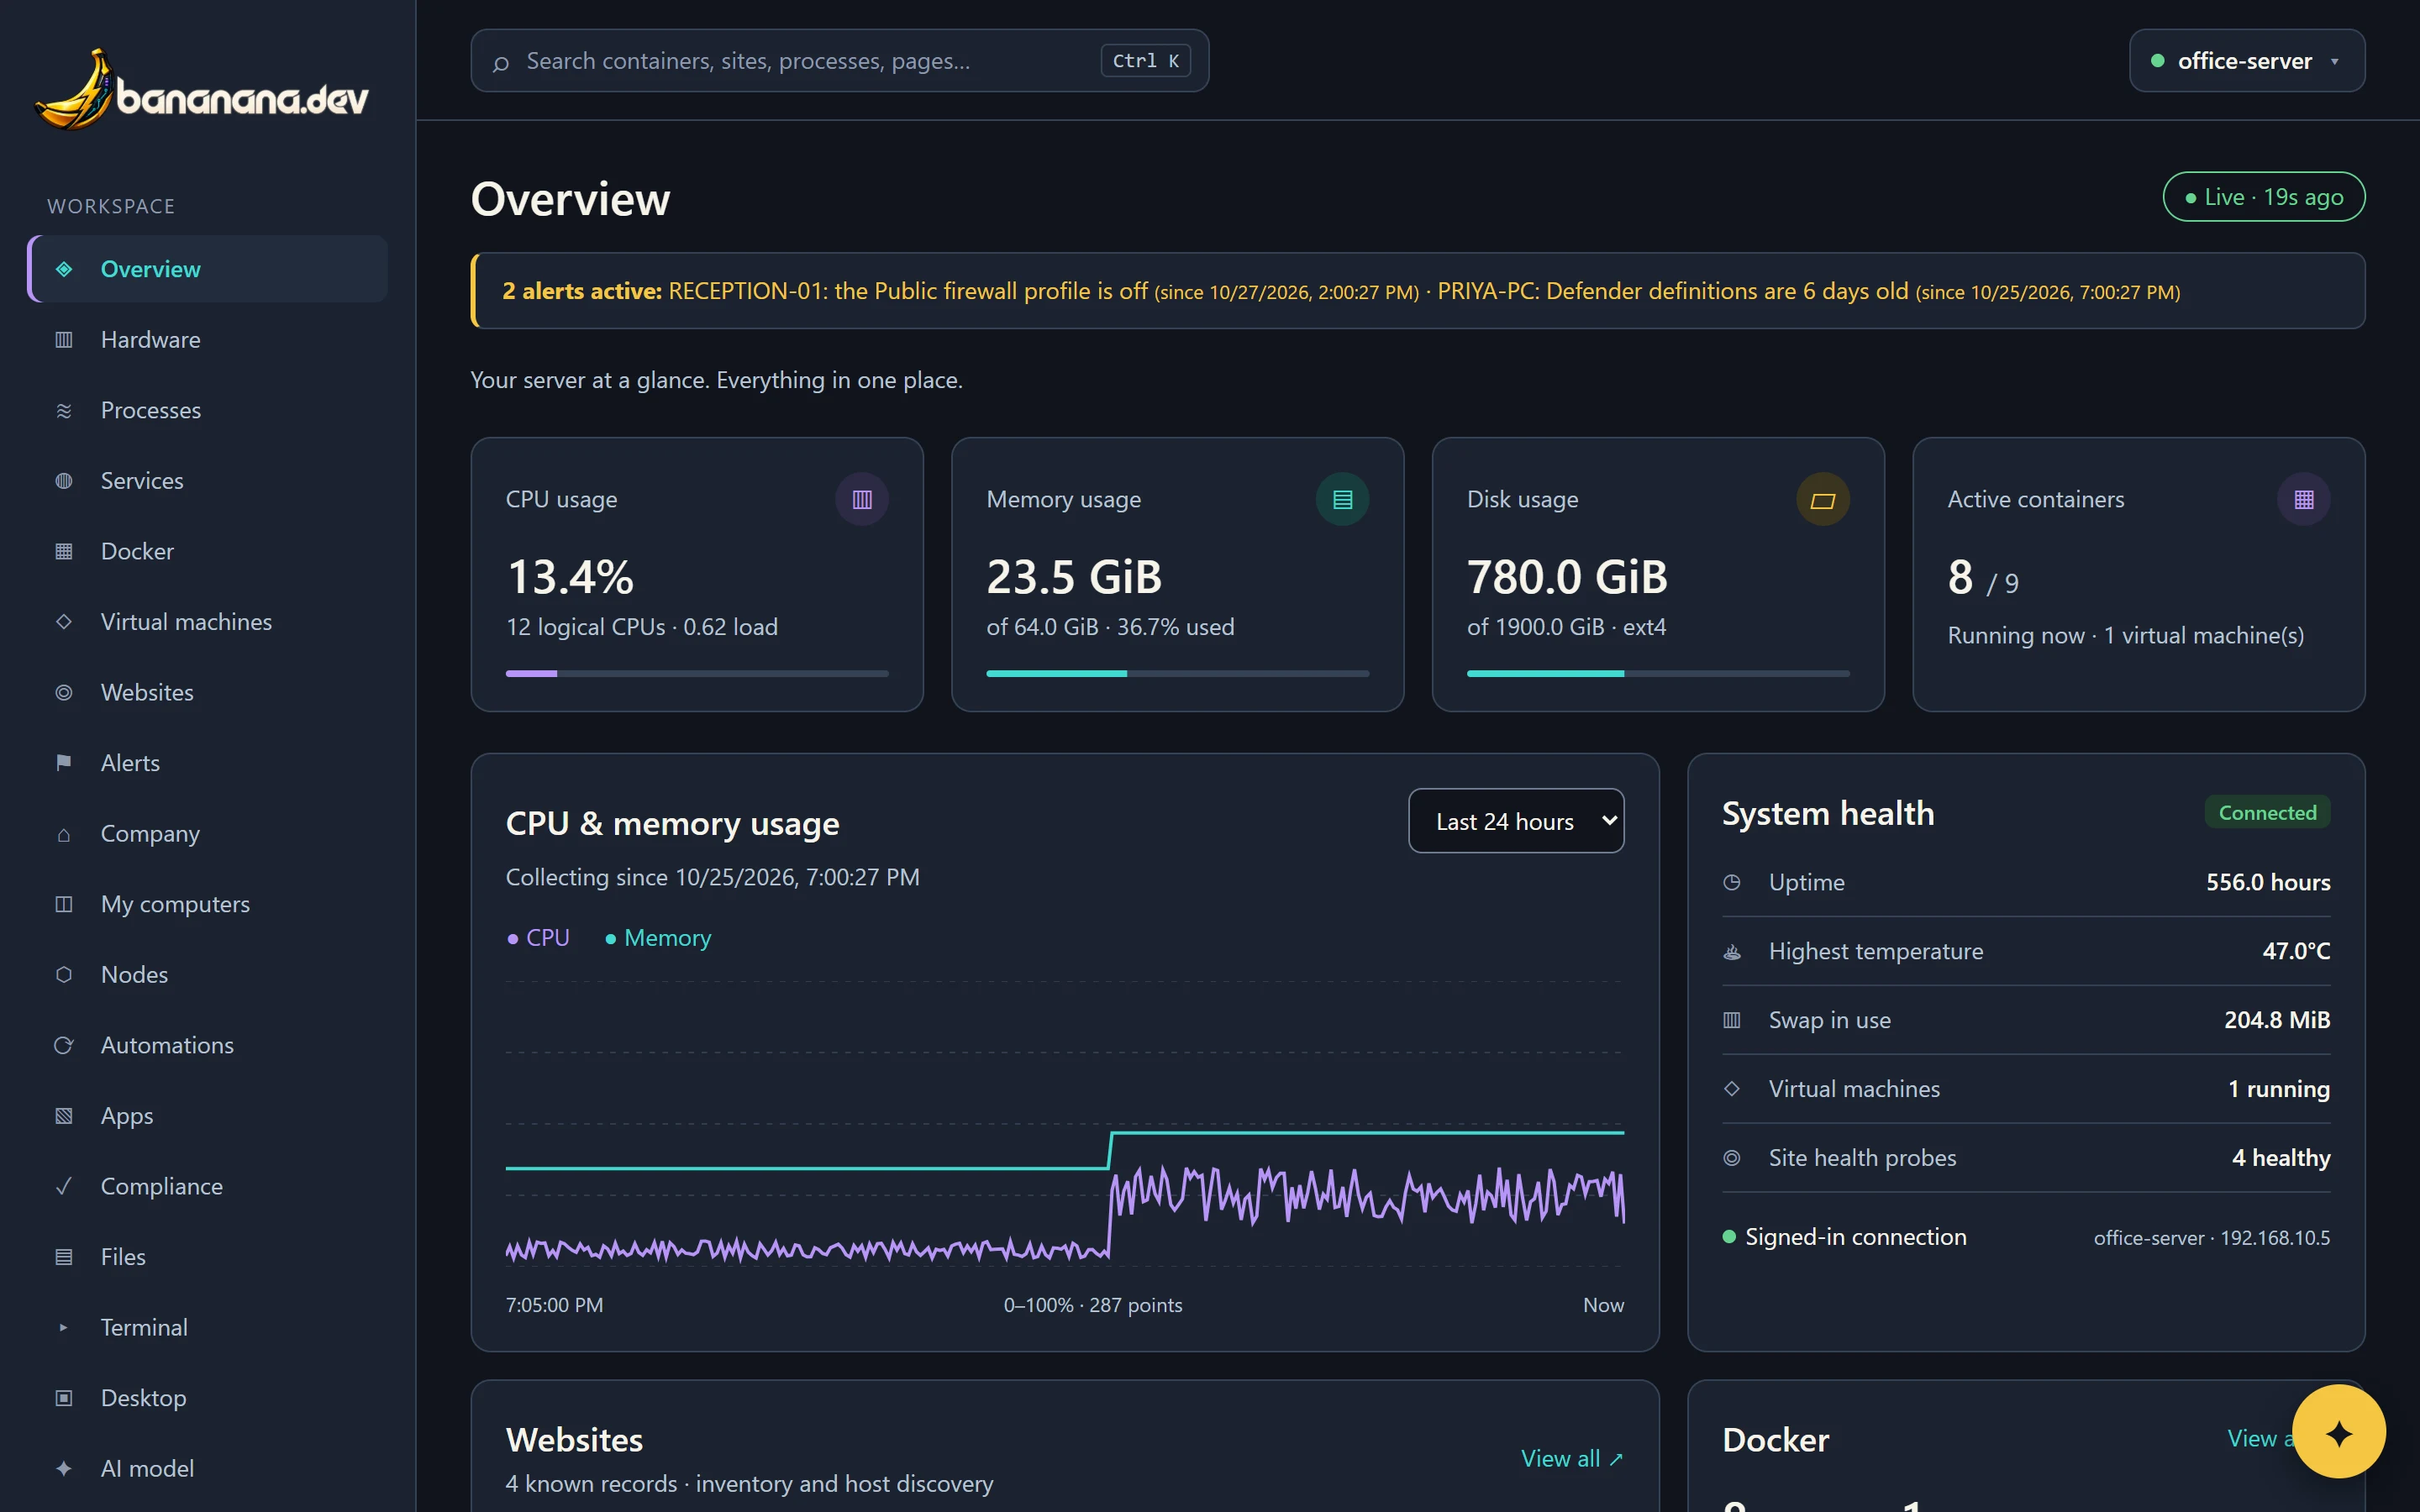
The chart's menu switches between the last hour, 24 hours, 7 days, 30 days and a year. The last hour updates every second; longer ranges use stored averages, kept for up to a year.
Hardware
Every sensor and counter: CPU, memory, temperatures, load, network interfaces with live speeds, each disk and how full it is, disk input/output, and the system services the brain runs, with how long each has been up.
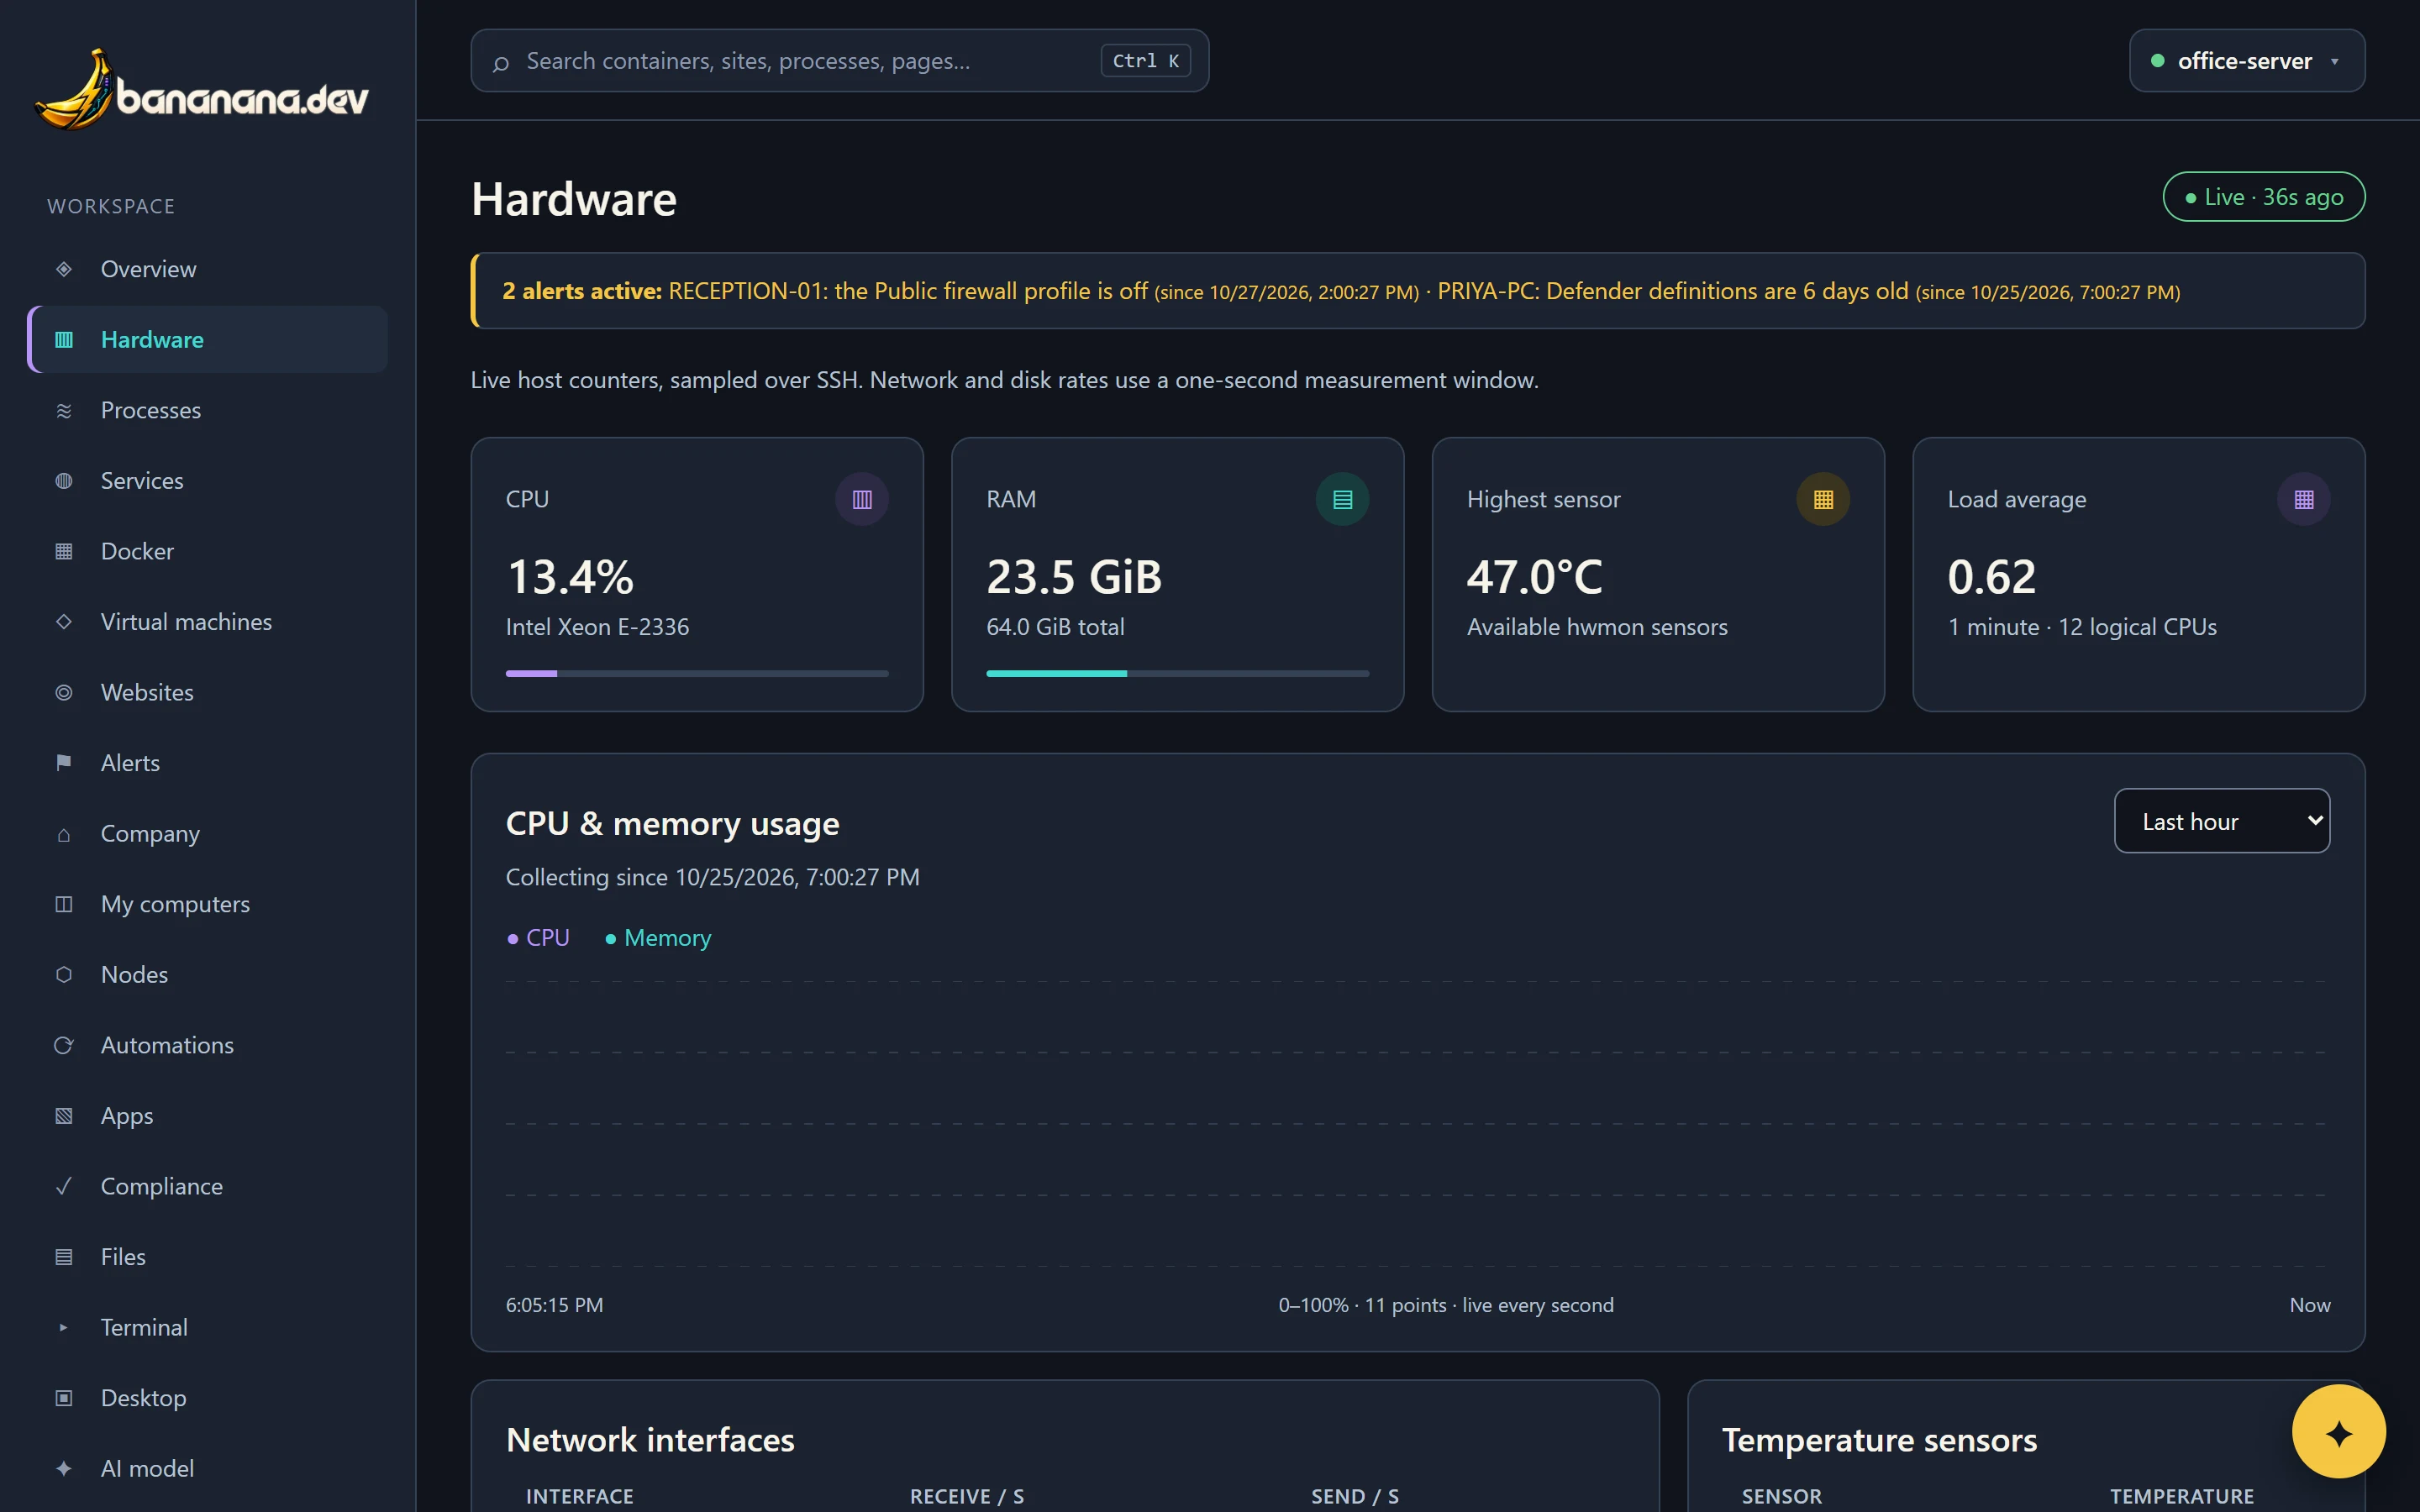
With a device picked in the top-right picker, the full hardware readout appears under the live charts: system and firmware, processor, memory modules, drives and their health, graphics, displays, network adapters, battery, printers, and every device grouped like Device Manager, with a search box and any driver problems at the top. It's the same readout as the device's Hardware tab on the Nodes page (see Devices).
Processes and Services
Processes lists what's running, busiest first; sort by CPU or memory and filter by name. Services (shown when a node is picked) lists the system services (Windows services, systemd units or launchd jobs) with Start, Stop and Restart buttons, if your role allows "Services and containers" and the node allows Services control.
Docker
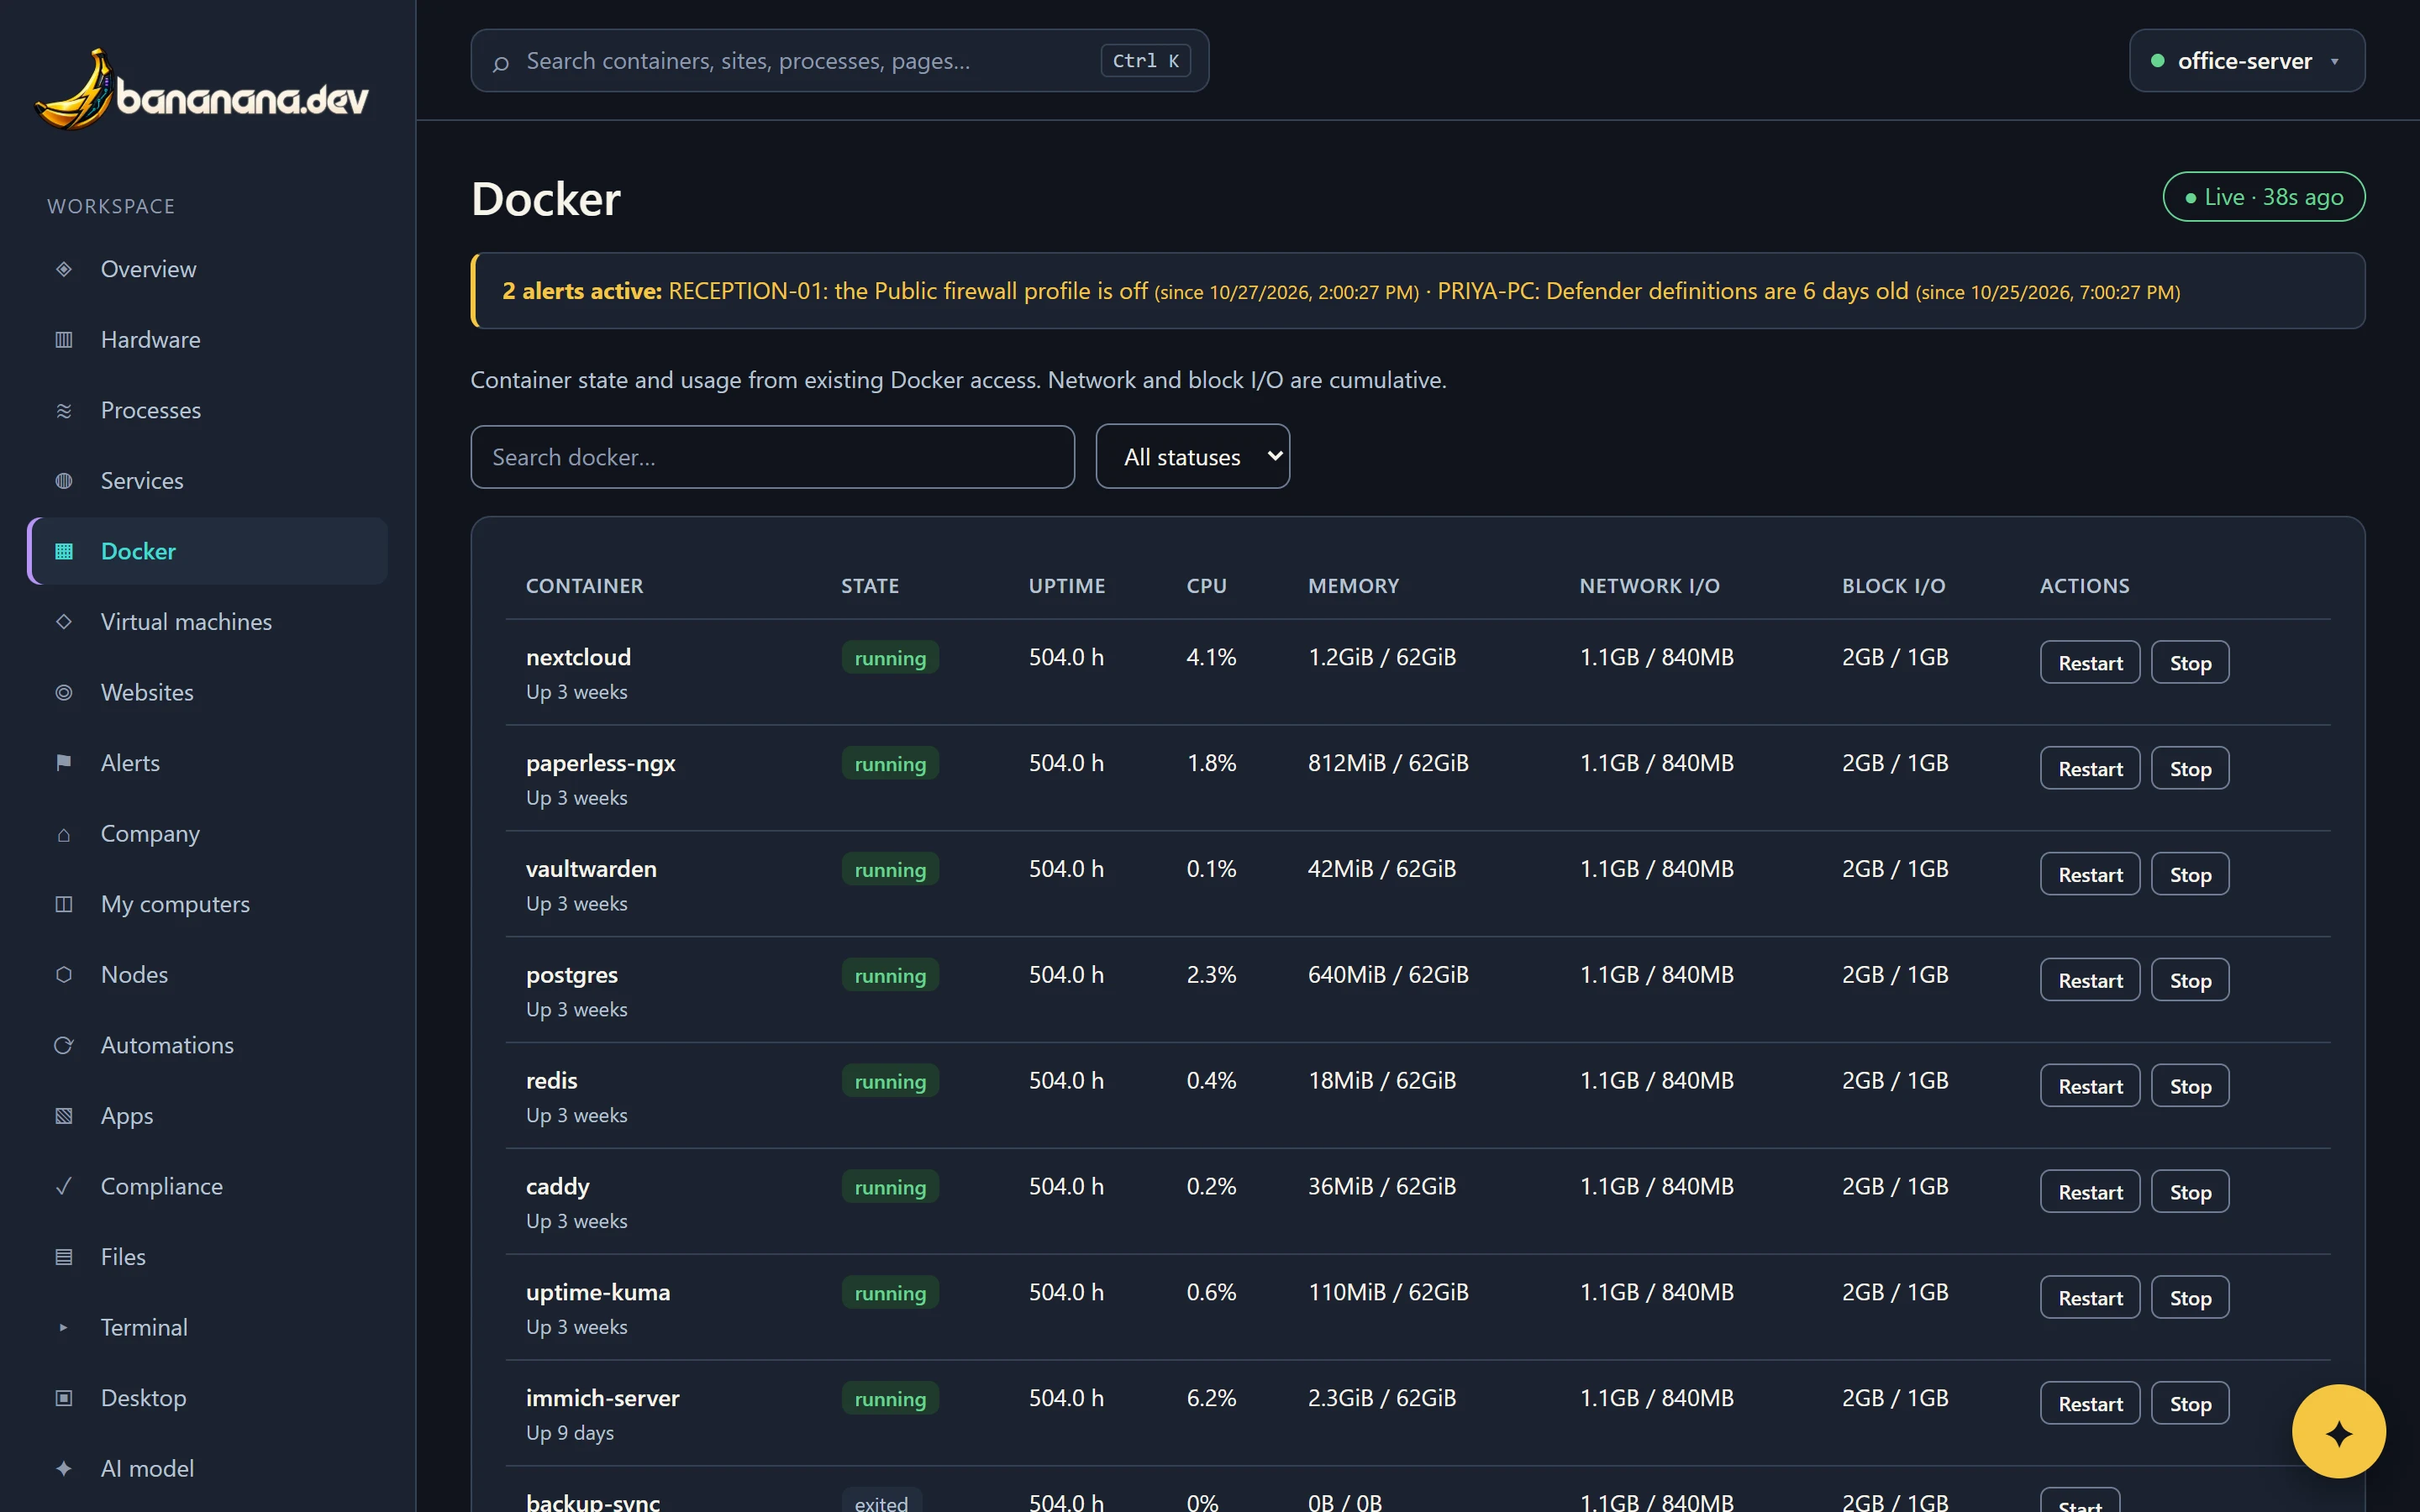
Every container with its state, uptime, CPU, memory, network and disk traffic. Restart, stop and start buttons work the same way as services. Some containers that bananana.dev itself needs are protected and can't be stopped from here.
Virtual machines
Virtual machines on the brain (libvirt and KVM), with their state, CPU and allocated memory, and buttons to start, shut down or force off.
Websites
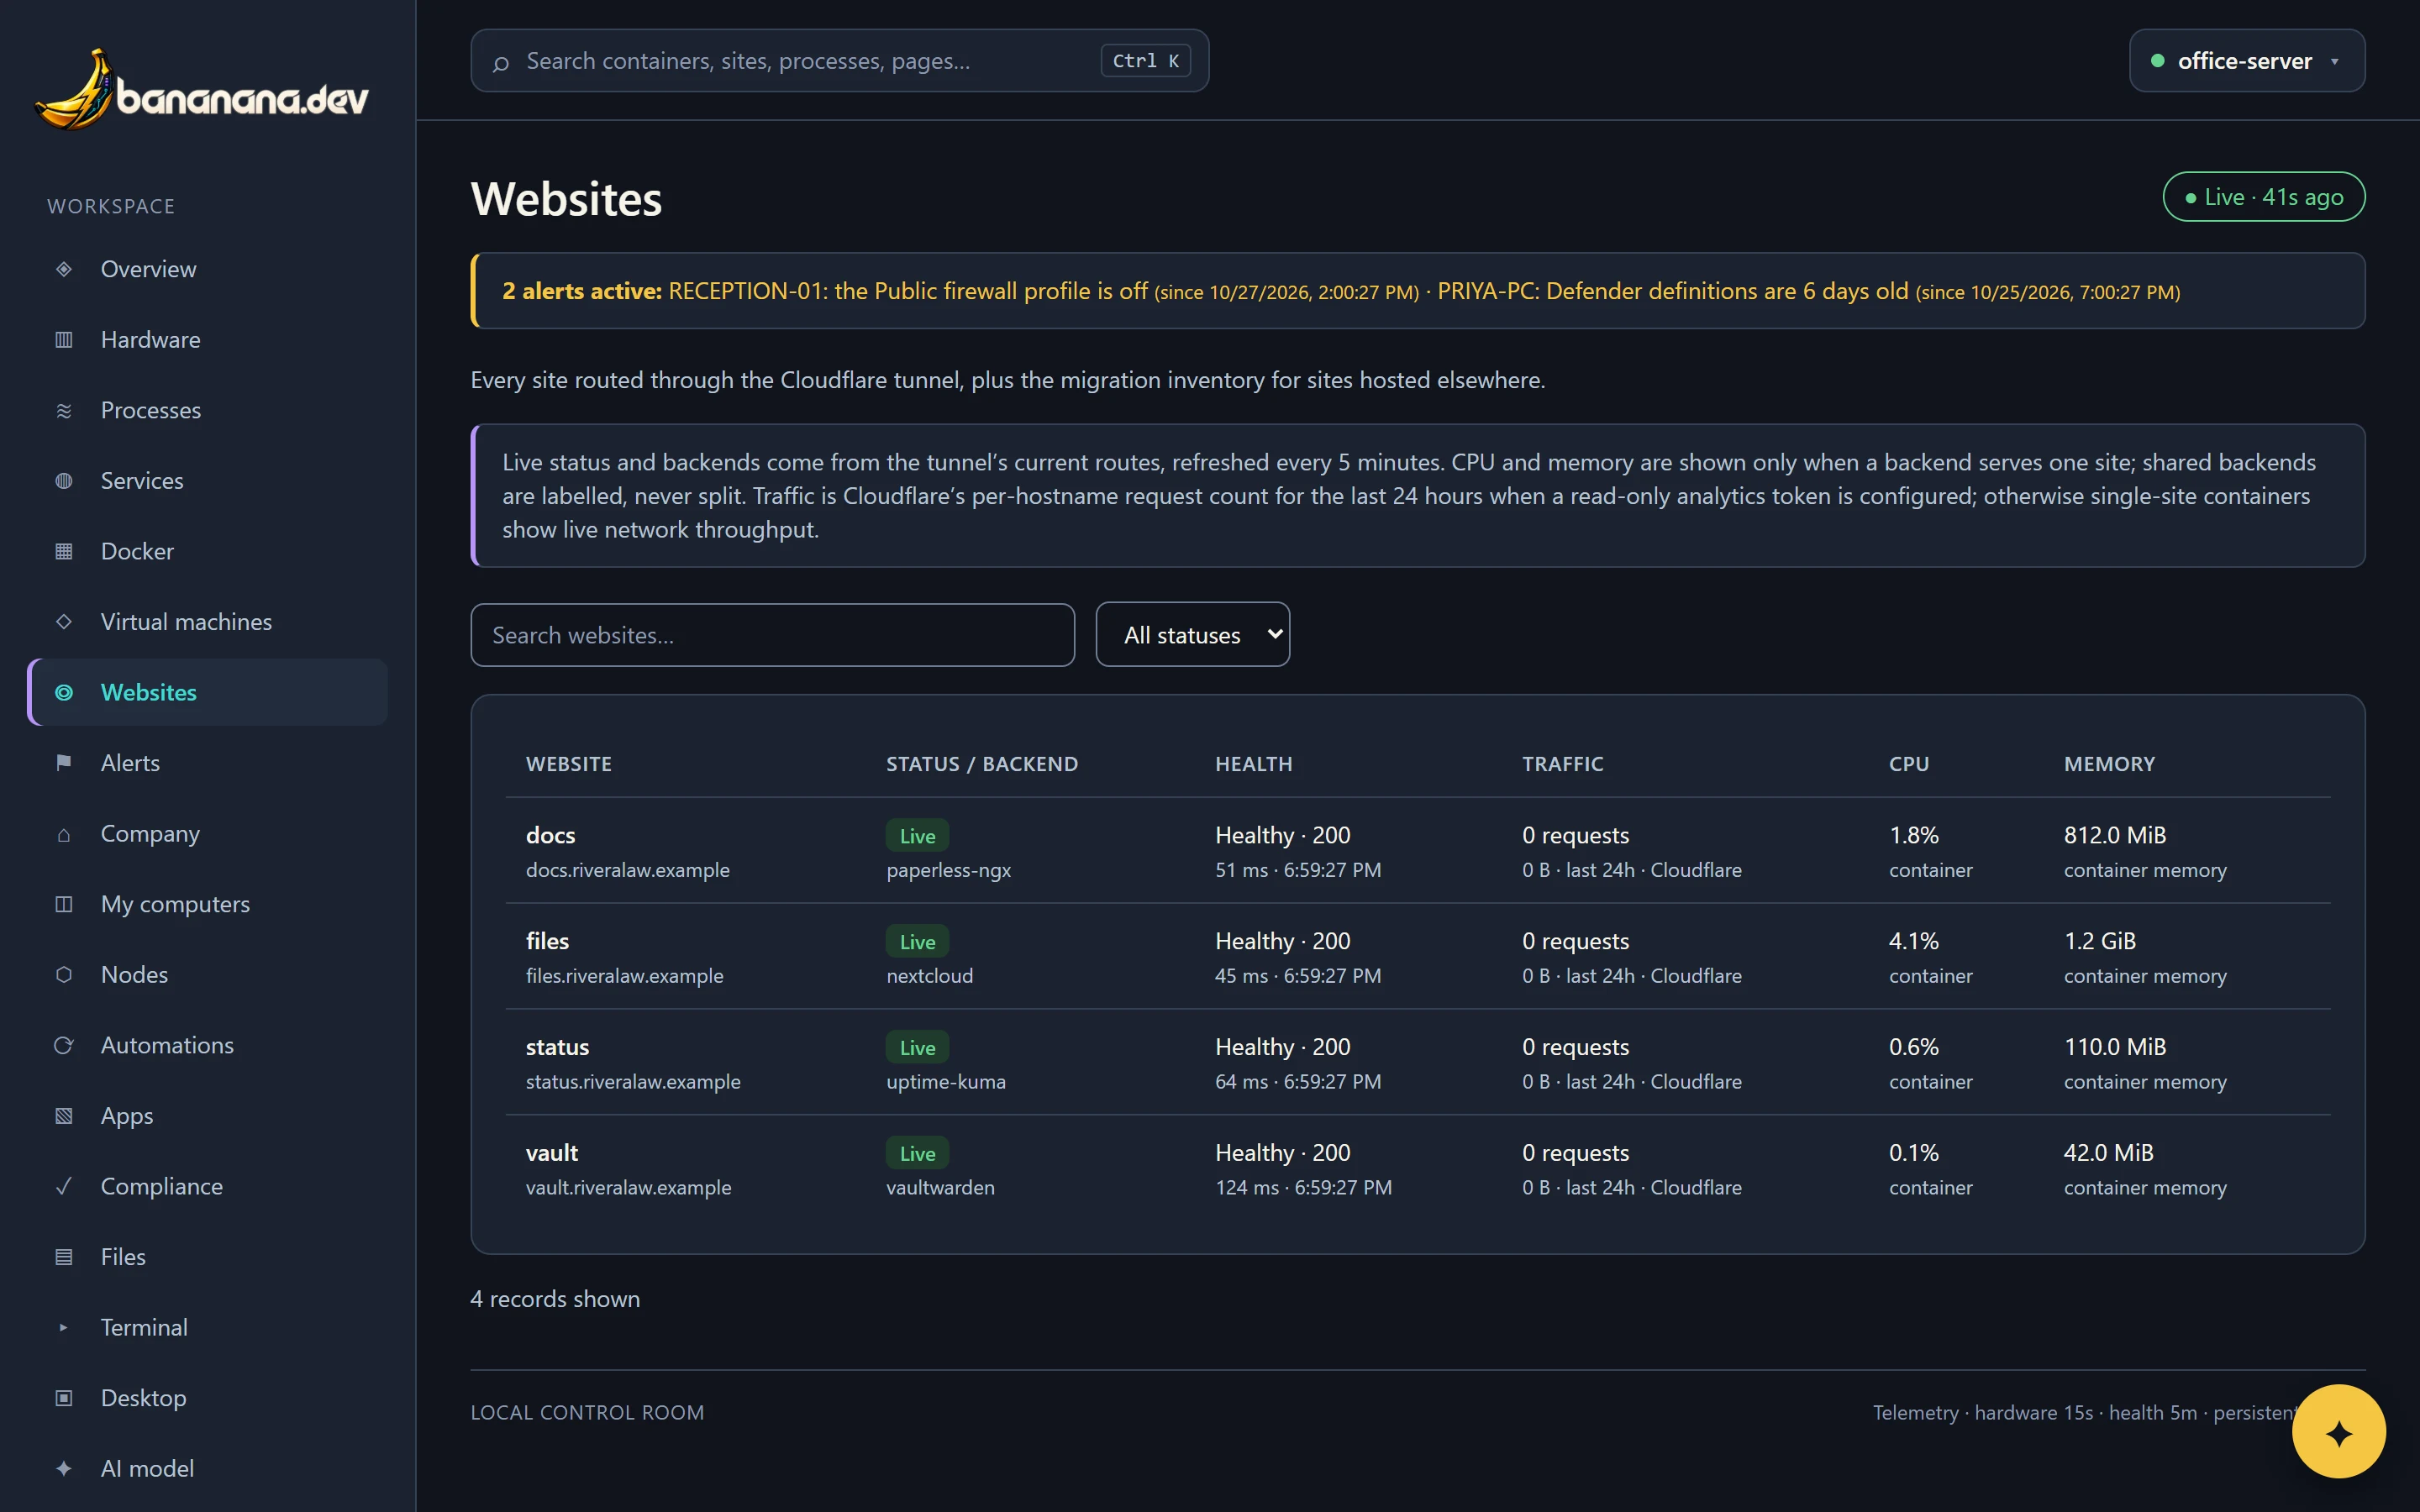
Every website the brain serves through its Cloudflare tunnel, plus any in its site list: status, which container or program serves it, a health check every five minutes with the response time, traffic in the last day (with a Cloudflare token set up), and the CPU and memory of the container behind it.
Alerts
What's wrong right now, and a history of every alert that started or cleared. bananana.dev watches:
- a disk 90% full or more (clears below 85%)
- a temperature sensor at 85 °C or more for a minute (clears below 80 °C)
- a website failing two health checks in a row (about ten minutes)
- the nightly backup missing for more than 36 hours, or failing
- on each Windows device: antivirus protection off, definitions older than 3 days, a detection in the last week, a firewall profile off
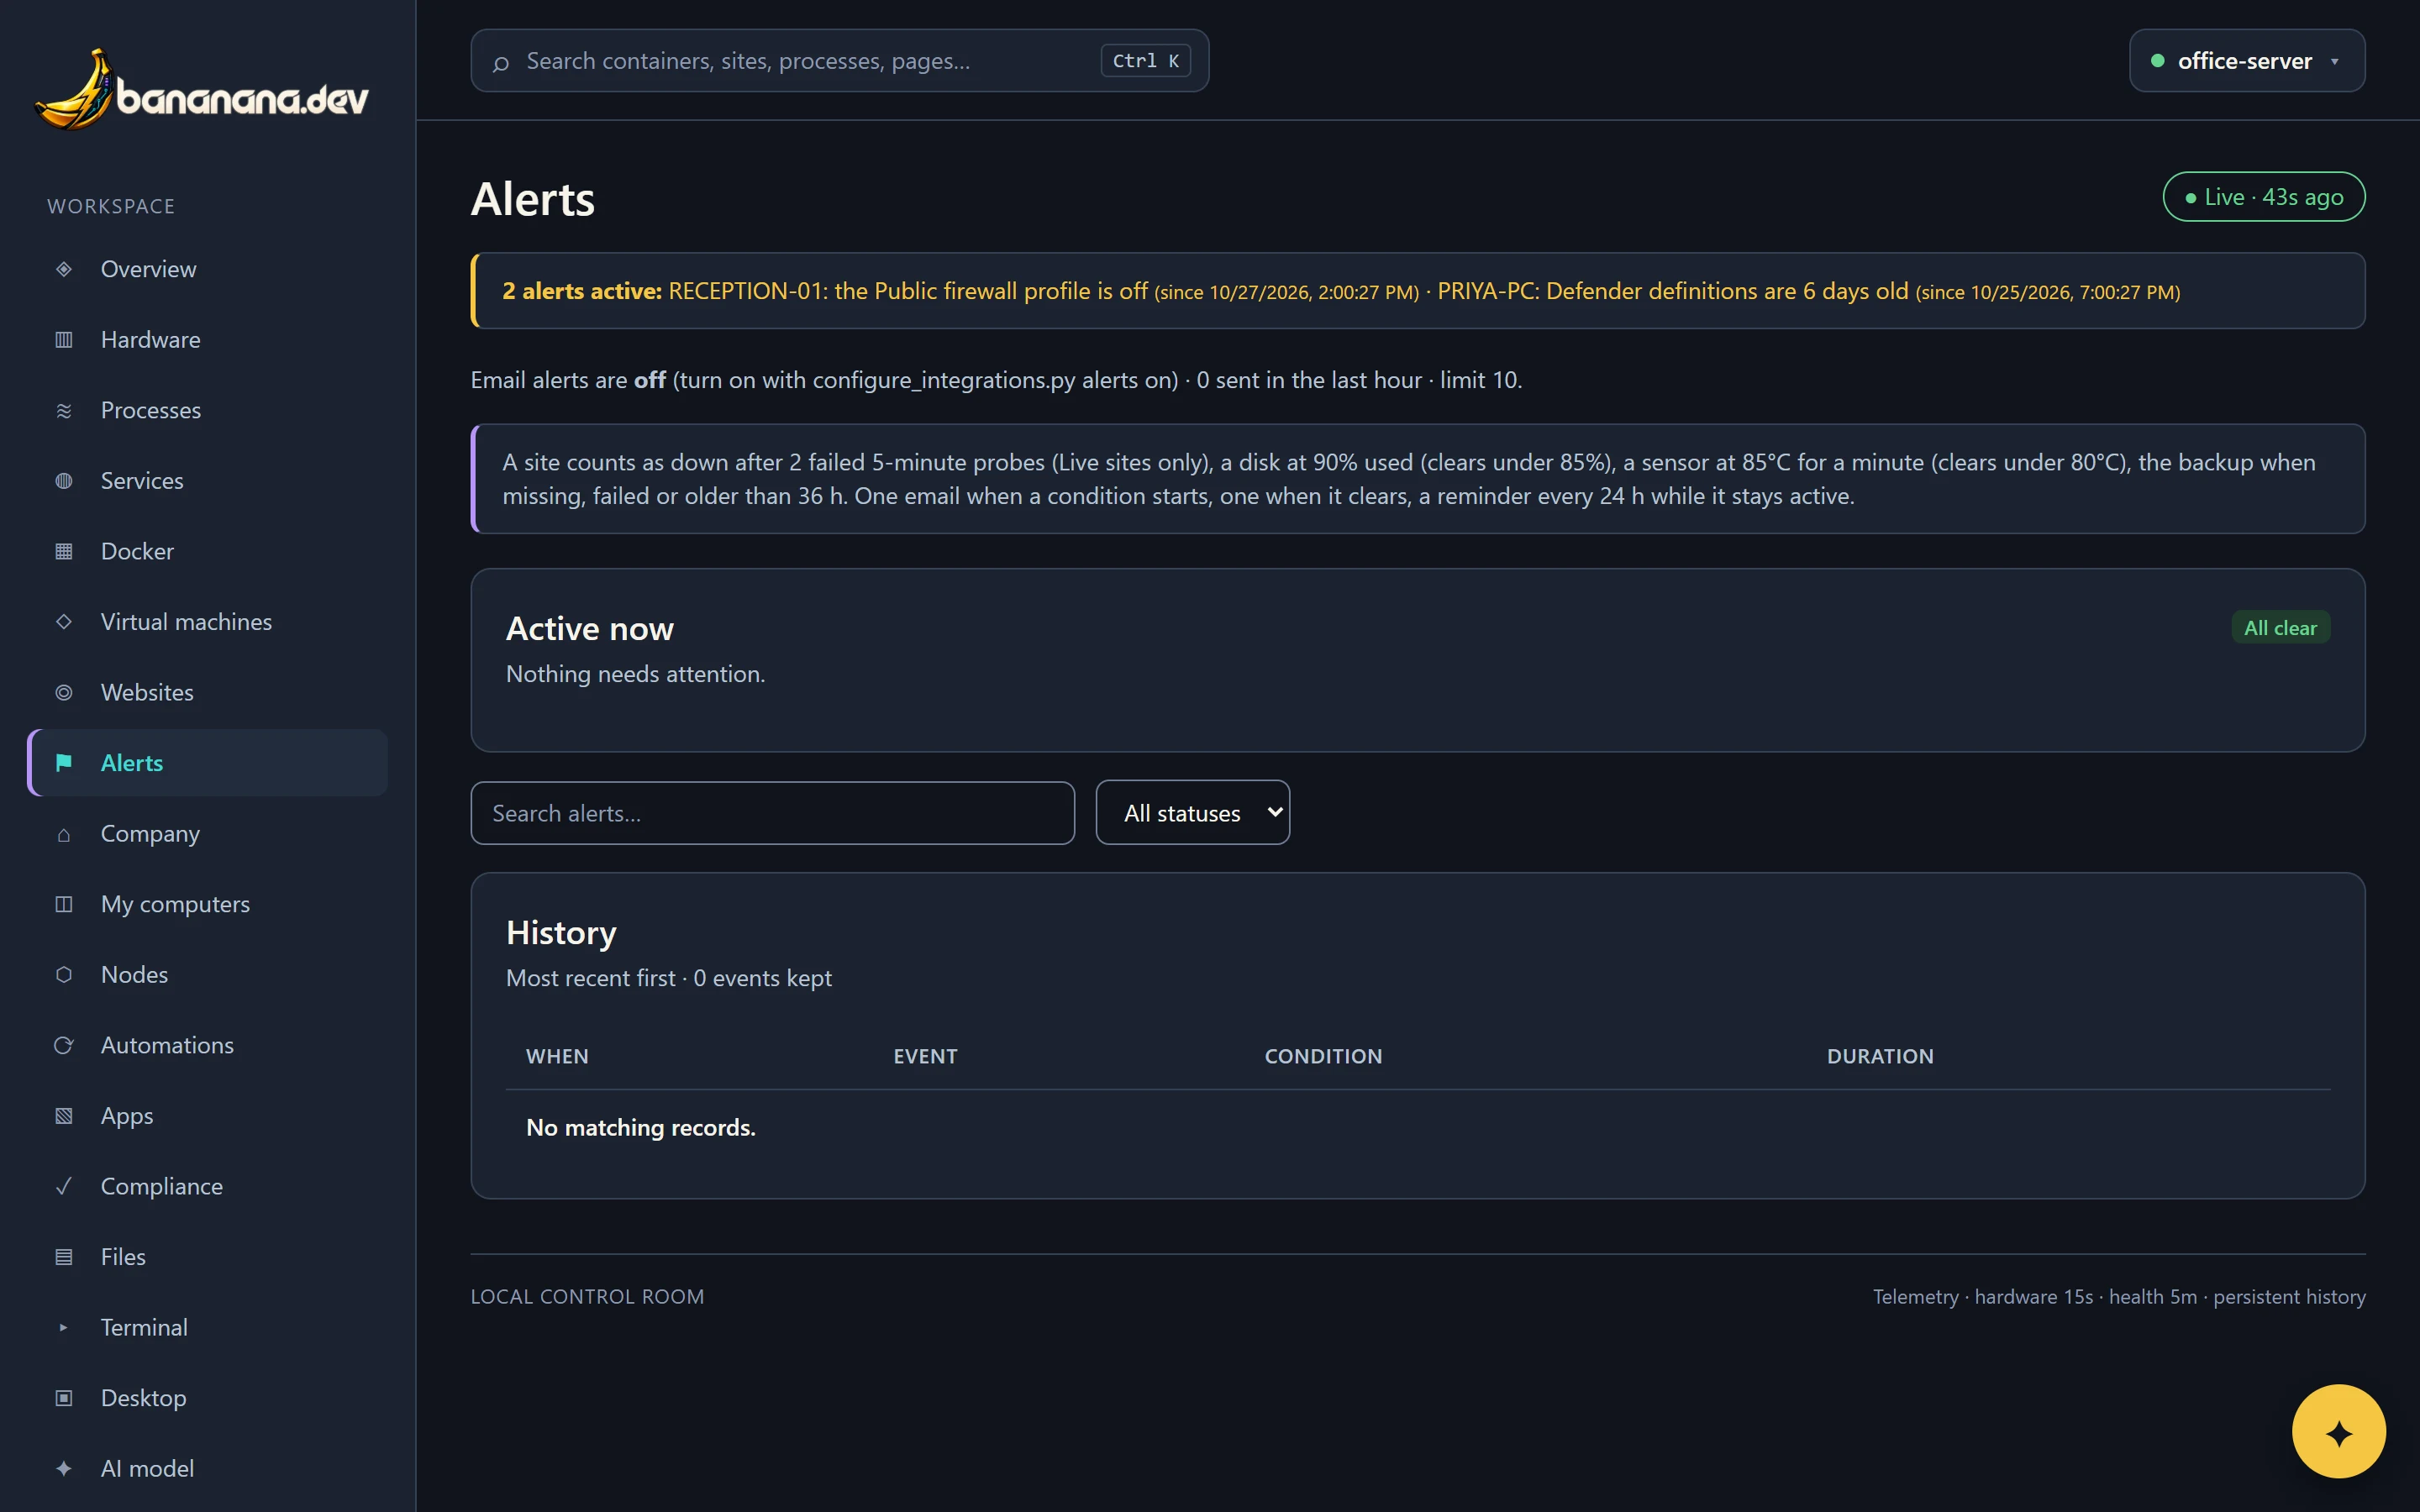
Each alert is emailed once when it starts, once when it clears, and once a day while it lasts, at most ten emails an hour. Every email explains what the problem means and how to fix it. More: Alerts and email.